Weather Station Data Visualization
Shape weather station data visualization UI for climate monitoring and meteorological analytics campaigns.
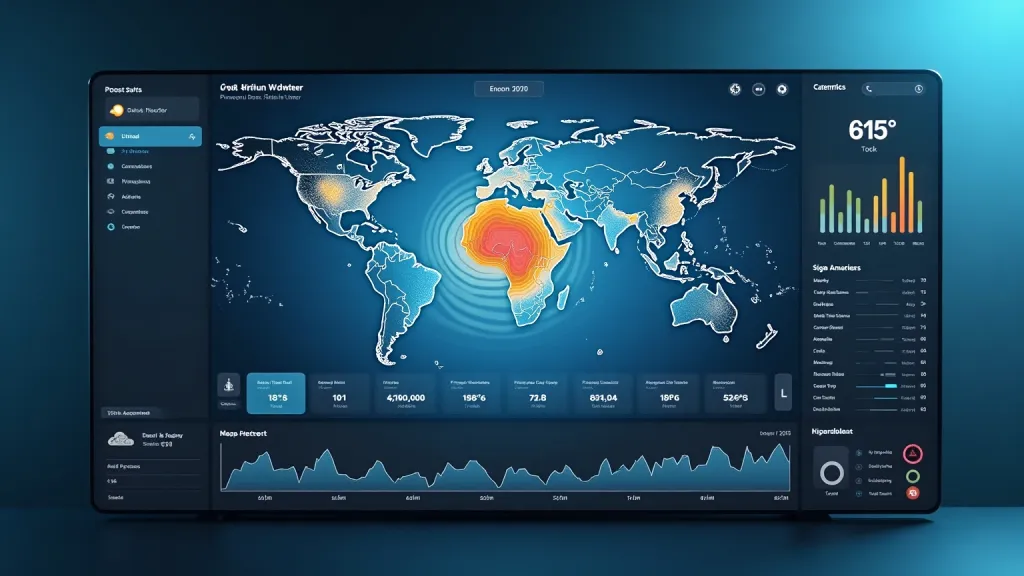
Shape a weather station data visualization interface that brings atmospheric data to life. The screen shows a large animated weather map with temperature gradients, precipitation patterns, and wind vectors. A sidebar displays real-time station readings and forecast charts. Composition: Center the weather map with sidebar controls on the right and a timeline of past readings at the bottom. Light and color: Deep blue,cool cyan,warm orange,white. Present the interface as a credible, production-ready digital product with a clear hierarchy, consistent spacing, accessible contrast, and legible microcopy. Keep every label readable and every component aligned; avoid gibberish text, overlapping panels, impossible devices, and decorative clutter.
Try nowSimilar prompts