How to Design Engaging PowerPoint Presentation Slides
You have probably watched a presenter explain something useful while the audience struggled to read a crowded slide. The information was there, but tiny labels, competing colors, and long paragraphs made it difficult to follow.
Engaging PowerPoint presentation slides reduce that effort. They help people recognize the main point, understand the evidence, and stay connected to the speaker. Decoration can add polish, but it cannot rescue an unclear message.
Whether you are preparing a marketing report, classroom lesson, student project, or executive update, the same principle applies: make every design choice support understanding. These practical presentation design tips focus on the decisions that matter most, from slide titles and layouts to typography, charts, and final review.
Start with One Clear Takeaway per Slide
Before adjusting the layout, finish this sentence: “After seeing this slide, the audience should understand that…” Your answer defines the slide’s main message.
A title such as “Quarterly Results” identifies a topic but leaves the audience to interpret it. “Renewals Drove This Quarter’s Revenue Growth” states a takeaway. The slide can then show the relevant revenue breakdown, supported by a short explanation of what changed.
This does not mean every slide needs only one fact. Several facts can support one conclusion. The problem begins when a single slide asks people to evaluate revenue, staffing, customer satisfaction, and next quarter’s priorities without a clear relationship.
For a dense business update, separate the performance finding from the staffing decision. Each deserves its own title and evidence.
Also distinguish presentation slides from leave-behind documents. Live slides support your spoken explanation; documents must explain themselves. Put extended methodology, definitions, and supporting detail in notes or an appendix where appropriate, while keeping essential context visible.
Choose Templates and Layouts That Fit Your Content
The best PowerPoint templates are not necessarily the most elaborate. They provide layouts that accommodate your actual material without forcing constant compromises.
Before choosing a template, test it with three representative slides: a chart, a text-and-visual explanation, and a recommendation. Check whether titles remain readable, labels fit, and content has enough room. A template that works beautifully for photographs may struggle with analytical business presentation slides.
Choose layouts according to the relationship you need to explain. A side-by-side arrangement supports comparison. A wide chart with a short takeaway supports a trend. A sequence of aligned steps supports a process.
Keep consistent margins and align related objects along shared edges. Leave enough whitespace to separate groups; empty space helps readers recognize which elements belong together.
PowerPoint’s built-in layouts provide reusable placeholders. Use Slide Master to establish recurring fonts, colors, and placeholder positions rather than manually restyling every slide. Consistency makes the deck easier to navigate and maintain.

Make Text and Color Easy to Read
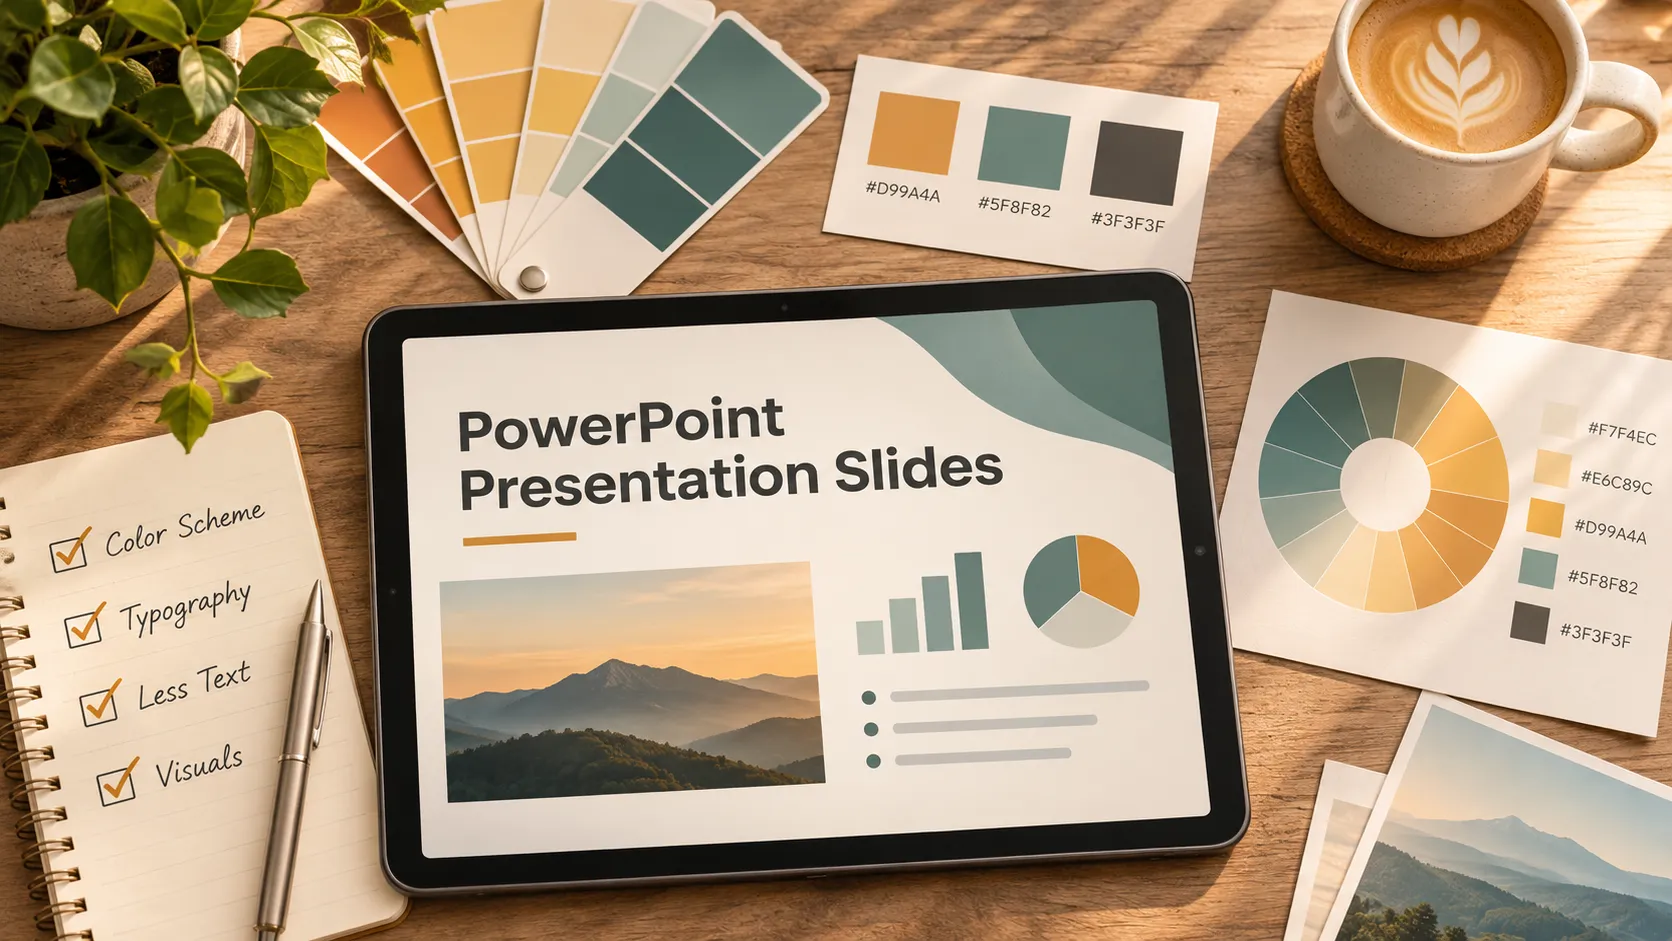
Readability is a foundation of effective PPT slides design. Begin with a restrained palette: a neutral background, a strong text color, and one or two accent colors are useful starting points. Add more only when they carry a clear meaning.
Use color deliberately. If blue identifies one product line, keep that association throughout the deck. Reserve a contrasting accent for the finding or action you want people to notice. Avoid relying on red and green alone to distinguish outcomes; add labels, symbols, or patterns.
Choose one readable font family, or two with clearly defined roles. Use size and weight to establish hierarchy: title first, main evidence second, supporting context third. Decorative fonts and excessive italics make extended reading harder.
For projected slides, body text around 24–32 points can be a useful starting range, but room size, display quality, typeface, and audience needs should determine the final choice. If content fits only after shrinking everything, reconsider the content or layout.
Replace report-style prose with concise, meaningful language. “Approval delays extended onboarding” is easier to scan than a paragraph describing the same finding. Keep the timeframe, evidence, and qualifications needed to interpret it accurately.
Turn Dense Information into Clear Visual Evidence
A visual earns its place when it explains something more clearly than text. A chart can reveal a pattern; a process diagram can clarify a sequence; an infographic can connect a small set of related facts. None is automatically better than a paragraph.
Match the visual to the audience’s question. Use a line chart to show change over time and a bar chart to compare categories. For exact values across several measures, a compact table may be more useful than a decorative graphic.
Suppose a sales update contains a paragraph about regional performance. A sorted bar chart can make the differences visible, while a title such as “The West Region Leads New-Customer Revenue” identifies the finding. Include the period and units so the comparison remains interpretable.
Preserve meaningful scales. Bar charts generally need a zero baseline because length communicates magnitude. If a line chart uses a narrowed range to reveal variation, make the axis clear and avoid exaggerating the change.
Remove 3D effects, unnecessary gridlines, and decorative backgrounds. Label key data directly where practical, and keep sources or methodological notes readable. For diagrams, use short labels and a clear reading direction rather than an intricate network of arrows.
Compare Common Slide Problems and Practical Fixes
When a slide feels difficult to follow, identify the communication problem before changing its styling. This comparison connects common symptoms with focused adjustments.
| Slide Problem | Design Adjustment | Communication Benefit |
|---|---|---|
| Crowded text | Separate the takeaway from supporting detail | Makes the main point easier to locate |
| Competing colors | Use a restrained palette with consistent meanings | Clarifies emphasis and grouping |
| Weak hierarchy | Differentiate title, evidence, and context | Establishes a clear reading order |
| Overloaded charts | Remove clutter and highlight relevant data | Makes comparisons easier to interpret |
These changes work together. Enlarging a headline will not resolve three unrelated messages, and simplifying a chart will not help if its title points to the wrong conclusion. Revise the message first, then the visual treatment.

Use Pi When Business Structure Also Needs Work
PowerPoint gives you control over slide composition. Sometimes, however, the challenge is deciding how the business argument should work before arranging content on a slide.
Pi, short for Presentation Intelligence, is an AI presentation maker for professional business presentations. Its Multi-Agent AI positioning emphasizes business logic, professional structure, and premium visual quality—an optional workflow when formatting is only part of the problem.
1. Business Logic Comes Before Slide Styling
Consider a sales presentation assembled from product features, customer research, and pricing notes. Attractive layouts alone cannot establish why the buyer should act.
A stronger argument connects the customer’s problem to its business impact, presents a relevant solution, supports the proposed value, and defines the next step. Pi’s business-ready focus is relevant when a team needs help developing that structure rather than simply decorating existing content.
2. Premium Visual Quality Supports the Argument
An executive presentation needs clear recommendations and visual discipline. Consistent hierarchy and focused evidence should help decision-makers distinguish the proposal, its rationale, and its risks.
Pi brings professional structure and premium aesthetics into the same presentation workflow. Treat its output as a draft requiring judgment: verify facts, challenge assumptions, review the narrative, and check audience fit. AI-generated polish does not establish accuracy or guarantee persuasion.
Check Your Slides Before You Present
Review your PowerPoint presentation slides in slideshow mode, preferably on the display you will use. Check whether titles, labels, and essential notes remain readable from the audience’s likely viewing distance.
Then inspect consistency and accessibility. Confirm that colors retain their meaning, text has strong contrast, and charts identify units, periods, and important qualifications. Use PowerPoint’s Accessibility Checker to flag potential issues, review reading order for shared files, and provide meaningful alternative text for informative visuals.
Keep transitions restrained. Animation is useful when revealing information in stages prevents confusion; otherwise, simple transitions usually keep attention on the content.
Finally, rehearse aloud. If you repeatedly explain what a slide is supposed to mean before discussing its evidence, revise the title or layout. Strong slides make your explanation easier to follow. If the argument itself still needs work, exploring Pi may be a useful next step.
Frequently Asked Questions (FAQ)
How much text should a PowerPoint slide contain?
Use enough text to communicate the takeaway and necessary context without competing with the speaker. There is no universal word limit. Replace unnecessary prose with concise phrases, but retain essential evidence, definitions, and qualifications.
What font size should I use for PowerPoint presentation slides?
For projected body text, 24–32 points is a useful starting range, not a fixed rule. Test readability on the intended screen and from the back of the room. Enlarge important labels rather than shrinking content to fit.
How do I choose the best PowerPoint templates?
Test templates with your real content. Look for readable typography, flexible chart layouts, consistent spacing, and useful placeholders. Choose a template that supports your message and viewing conditions rather than one that simply looks impressive in a preview.
How can I make business presentation slides more engaging?
Give each slide a clear takeaway, connect evidence to a relevant business question, and make comparisons easy to interpret. Use purposeful visuals and concise titles. Rehearse to ensure the slides support your explanation rather than duplicate it.