Urban Farming IoT Sensor Dashboard
Frame urban farming IoT sensor dashboard UI for smart agriculture and vertical farm monitoring campaigns.
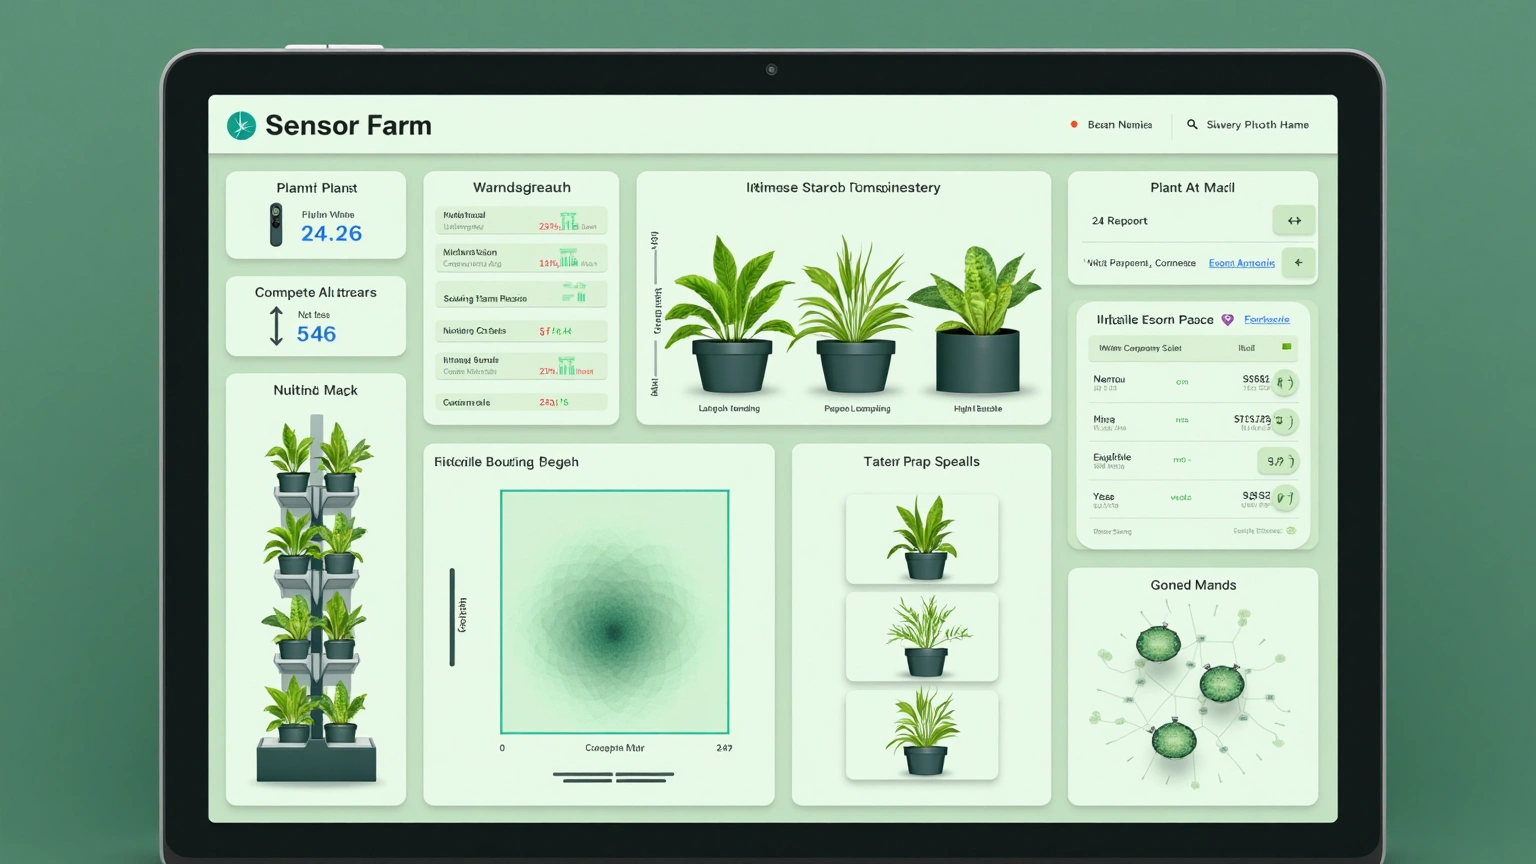
Frame an urban farming IoT sensor dashboard that monitors plant health across a vertical farm facility. The interface displays real-time sensor data including temperature, humidity, light intensity, and nutrient levels across multiple growing zones. A plant health heat map shows crop status at a glance. Composition: Place the sensor overview across the top, a zonal map in the center-left, and individual plant detail cards on the right. Light and color: Fresh green,navy,dark teal,soft white. Present the interface as a credible, production-ready digital product with a clear hierarchy, consistent spacing, accessible contrast, and legible microcopy. Keep every label readable and every component aligned; avoid gibberish text, overlapping panels, impossible devices, and decorative clutter.
Try now