Year in Numbers Annual Results Infographic
Art-direct a year in numbers concept as a high-impact hero visual. A professional organization summarizes revenue growth, customers served, emissions reduced, and employee impact in one data-led social graphic.
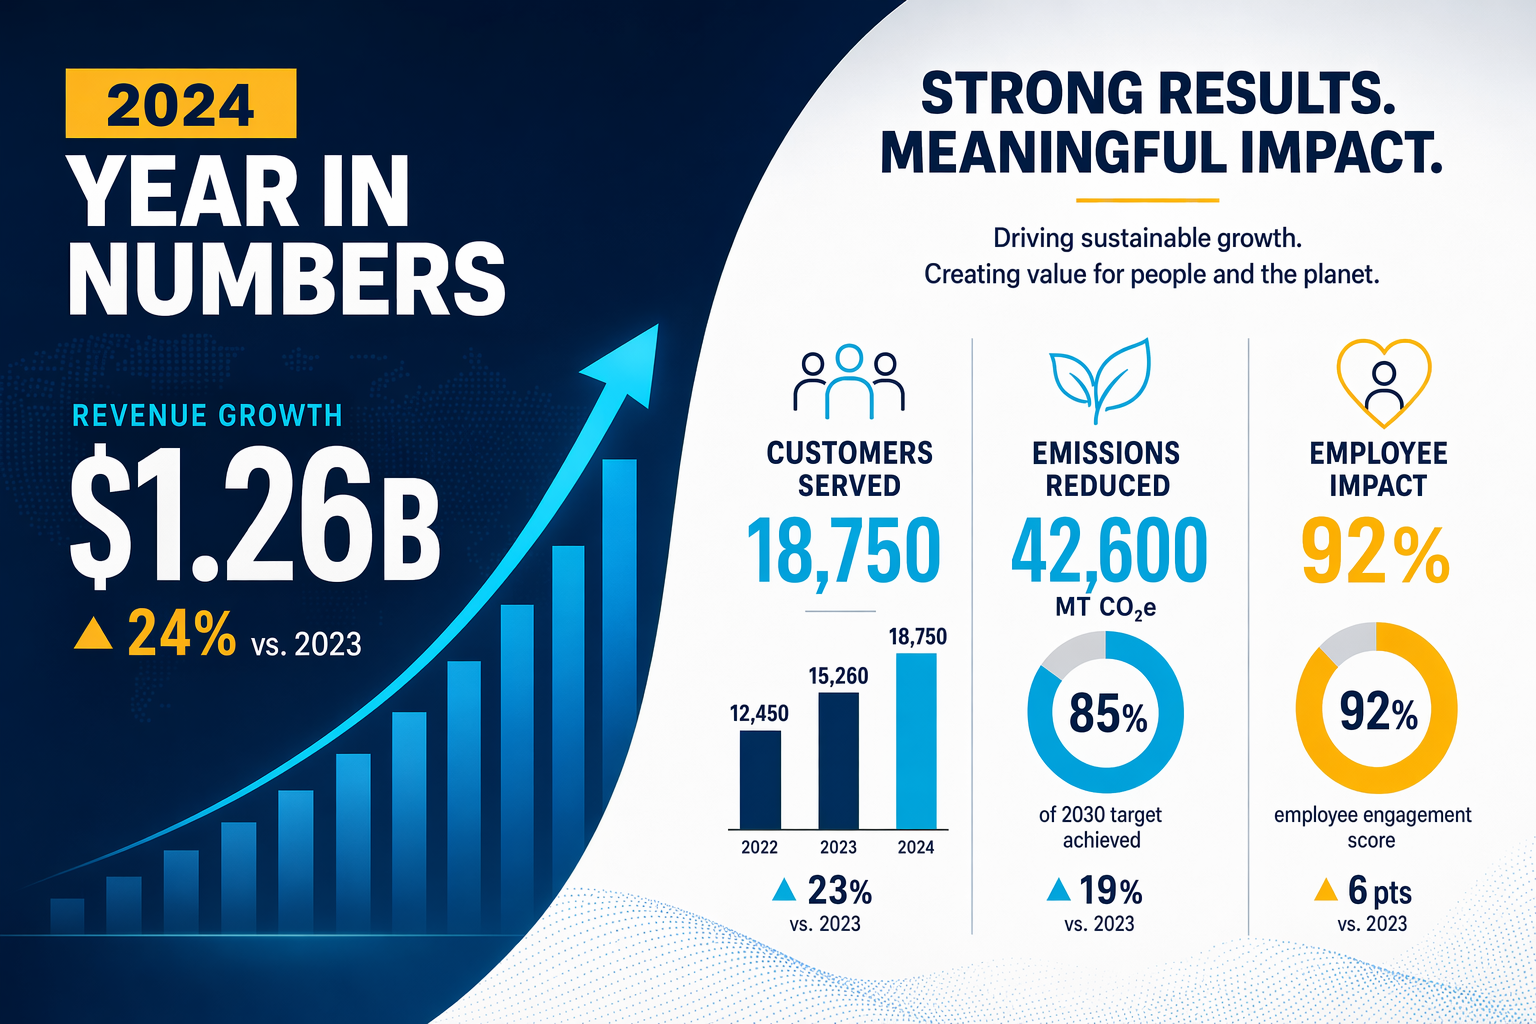
Art-direct a year in numbers concept as a high-impact hero visual. A professional organization summarizes revenue growth, customers served, emissions reduced, and employee impact in one data-led social graphic. Art direction: Use exact numbers, clear chart forms, and authoritative corporate design. Across a wide horizontal frame, place the largest metric on the left, arrange three supporting metrics on the right, and keep the header open. Light and palette: Navy, white, cyan, and warm yellow. Design a scroll-stopping campaign visual with an immediate message hierarchy, platform-ready polish, clear subject separation, and space for concise copy. Keep the headline and event details exact and readable at thumbnail size; avoid platform chrome, engagement counters, and overcrowding.
Try nowSimilar prompts