Customer Sentiment Feedback Analysis Reviews
For sentiment analysis dashboard UI with customer feedback and review analytics, designed for satisfaction metrics and visualization.
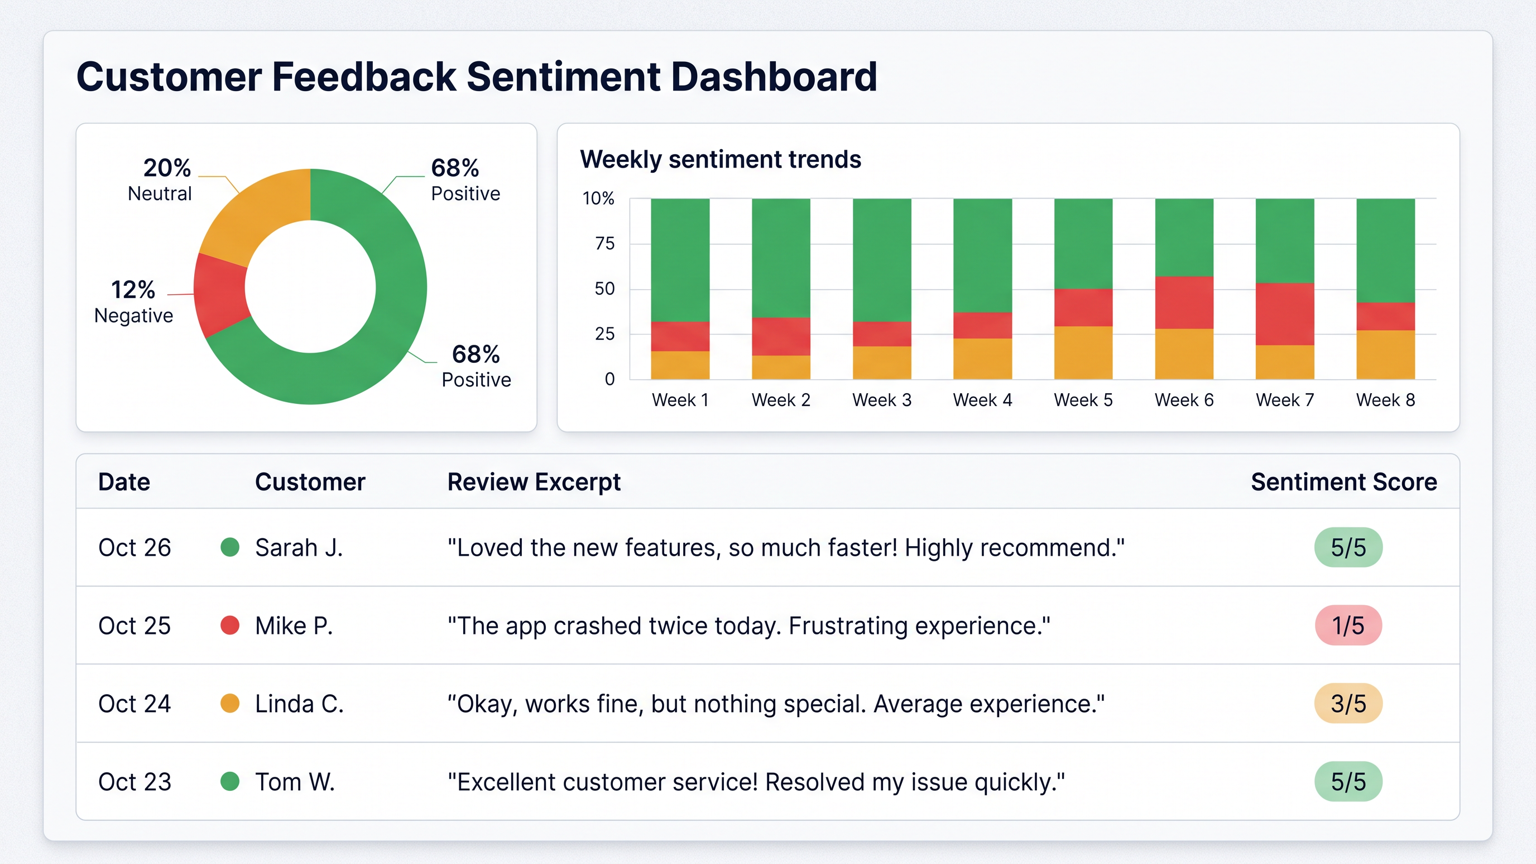
Design a customer feedback sentiment analysis dashboard with clear visualization of opinion data. A donut chart shows sentiment breakdown with exact percentages and color coding: green for positive, red for negative, amber for neutral. A bar chart alongside displays weekly sentiment trends with crisp bars and clear labels. A list below shows recent reviews with sentiment scores and excerpts. The palette is clean: white backgrounds, navy text, and consistent color coding for sentiment. Use realistic feedback data. Avoid placeholder text, overlapping elements, decorative clutter, and exaggerated visual effects.
Try now