Fitness Progress Analytics Dashboard Screen
Present fitness progress analytics dashboard screen as a motivational data visualization tool for tracking workout performance and personal records.
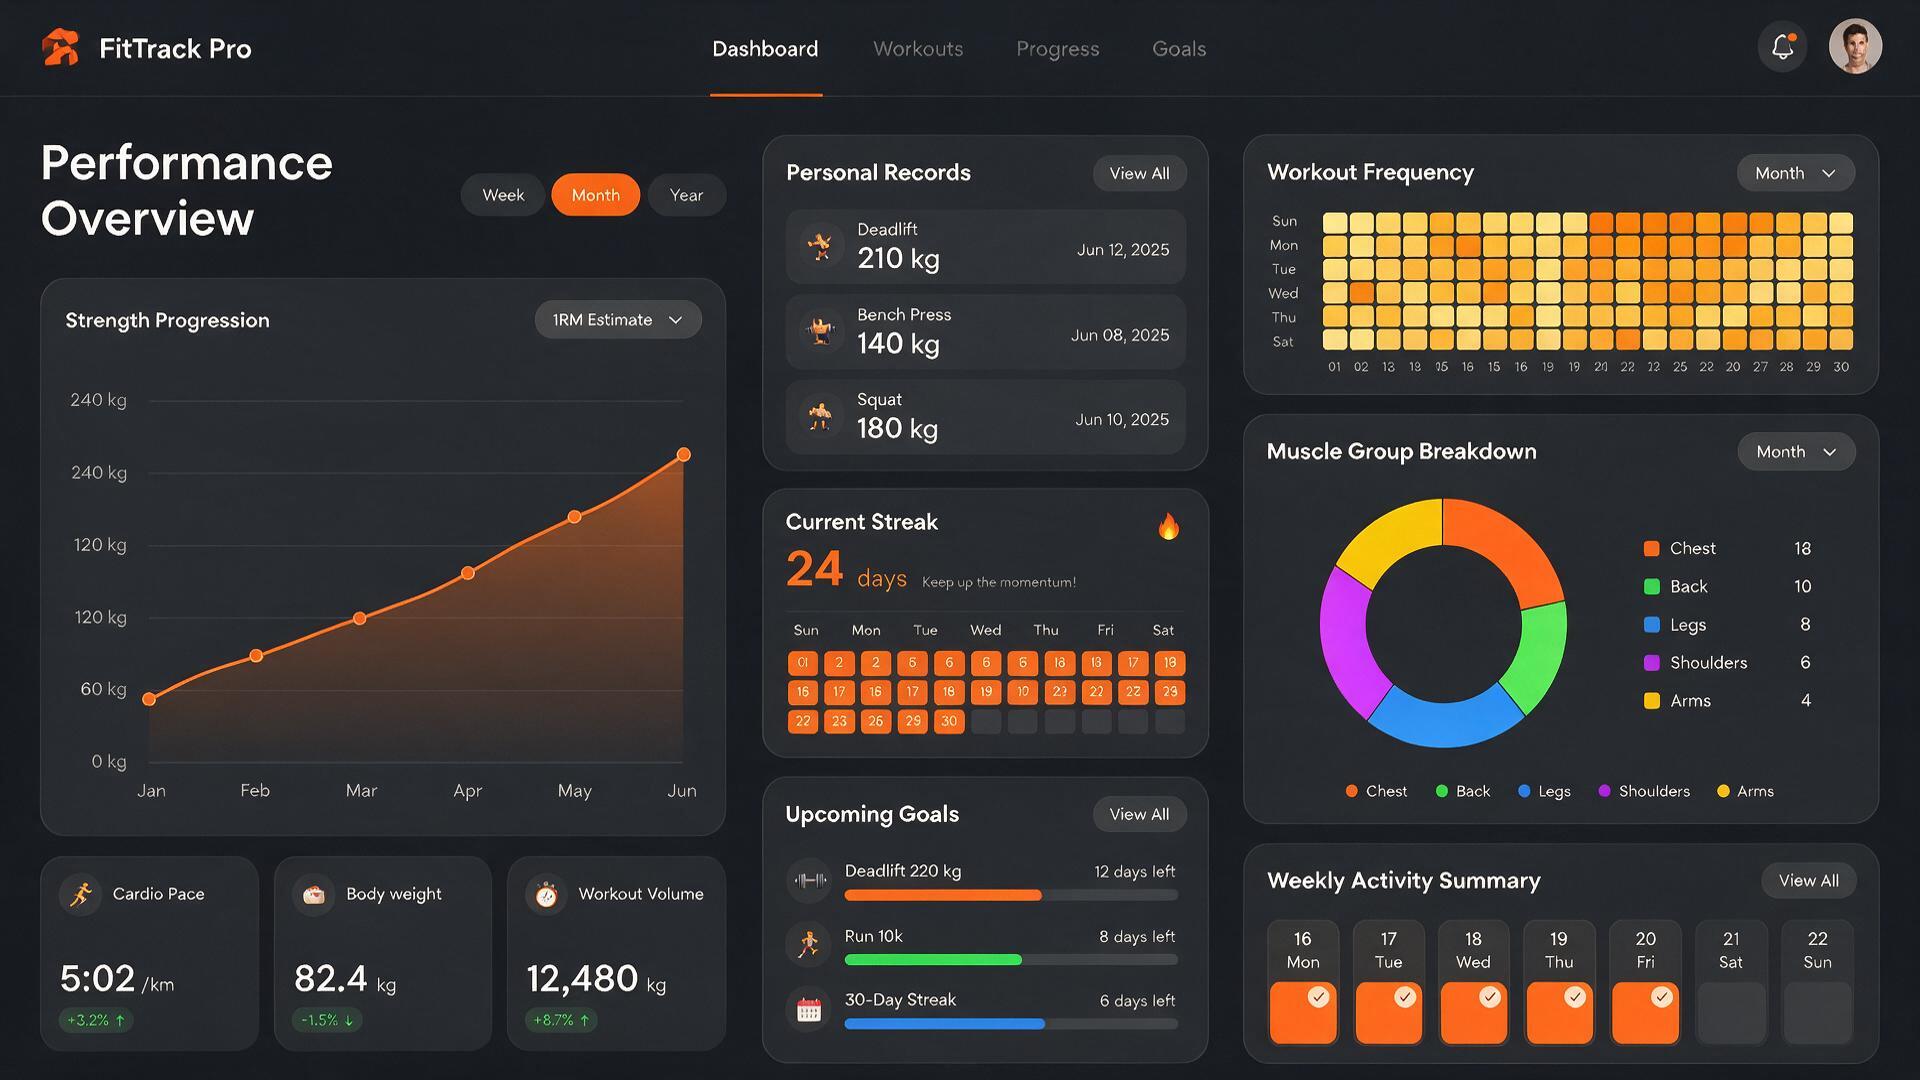
Present fitness progress analytics dashboard screen as a motivational data visualization tool for tracking workout performance and personal records. The interface shows a comprehensive workout summary with charts for strength progression, cardio metrics, body measurements, and workout frequency. Key cards display personal records, current streak days, and upcoming goals. The dashboard includes a weekly activity summary and exercise breakdown by muscle group. Frame the composition with the main performance chart on the left, personal records and key metrics in the center, and exercise breakdown and streak display on the right. Present the interface as a credible, production-ready digital product with a clear hierarchy, consistent spacing, accessible contrast, and legible microcopy. Use an energetic color palette with vibrant accent colors to motivate user engagement while maintaining data clarity. Keep every label readable and every component aligned; avoid gibberish text, overlapping panels, impossible devices, and decorative clutter.
Try now